> ## Documentation Index
> Fetch the complete documentation index at: https://asymptotelabs-fix-postinstall-refresh-user-hooks.mintlify.site/llms.txt
> Use this file to discover all available pages before exploring further.
# Test the Local Dashboard
> Use the local Beacon dashboard to validate endpoint events and security summaries
## Overview
The Beacon endpoint dashboard is a local-only, read-only UI for inspecting the runtime JSONL log. Use it after health checks and validation events to confirm that local events are visible to an analyst.
This guide shows how to open the dashboard, write a known event, verify Log Search, and review Security Overview.
## Setup
Confirm endpoint health and write a validation event:
```bash title="Prepare dashboard test data" theme={null}
beacon endpoint status
beacon endpoint test-event
```
## 1. Open The Dashboard
Start the dashboard and open it in your browser:
```bash title="Open the local dashboard" theme={null}
beacon endpoint dashboard --open
```
```bash title="Sample output" theme={null}
$ beacon endpoint dashboard --open
Reading runtime log: ~/.beacon/endpoint/logs/runtime.jsonl
Dashboard listening on http://127.0.0.1:8765
Opened browser window
```
By default, the dashboard binds to a loopback address and reads the configured runtime log plus its numbered local archives. It is intended for local investigation, not remote administration.
To use a custom local address:
```bash title="Use a custom dashboard address" theme={null}
beacon endpoint dashboard --addr 127.0.0.1:8765
```
To inspect a specific runtime log:
```bash title="Read a specific runtime log" theme={null}
beacon endpoint dashboard --log-path /path/to/runtime.jsonl
```
## 2. Test Log Search
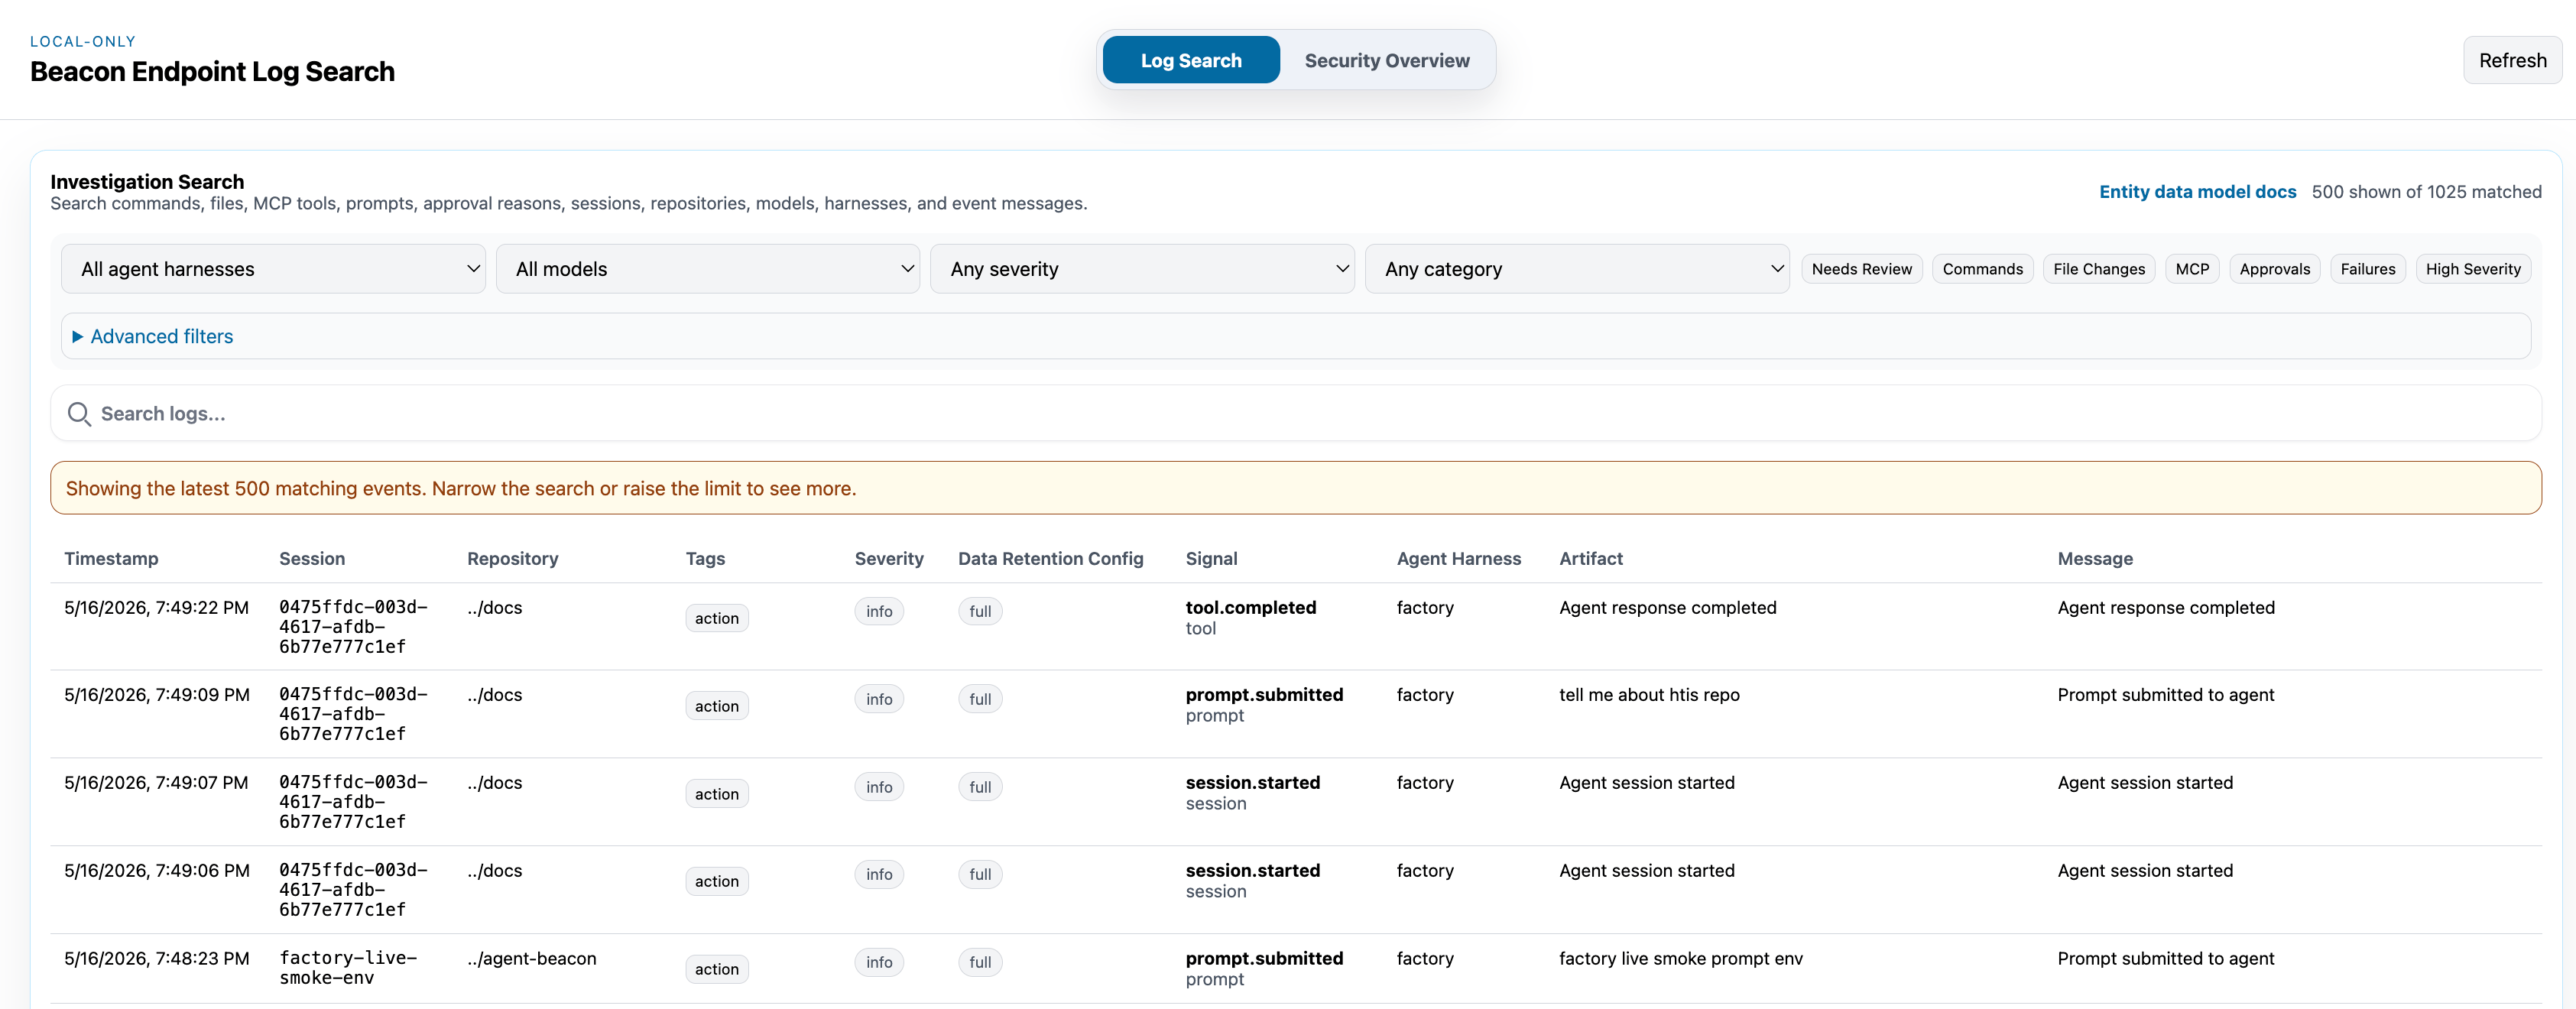
Write a validation event, then open Log Search and confirm the event appears in the table.
```bash title="Create data for Log Search" theme={null}
beacon endpoint test-event
beacon endpoint dashboard --open
```
Use filters and quick filters to narrow the view by harness, model, severity, category, failures, approvals, MCP activity, file changes, commands, or events that may need review. Event details should open for rows from either the active log or a rotated archive.
 ## 3. Test Security Overview
Open Security Overview after writing test events or generating local agent activity. Confirm the summary cards and inventory panels reflect the local runtime log you are testing.
## 3. Test Security Overview
Open Security Overview after writing test events or generating local agent activity. Confirm the summary cards and inventory panels reflect the local runtime log you are testing.
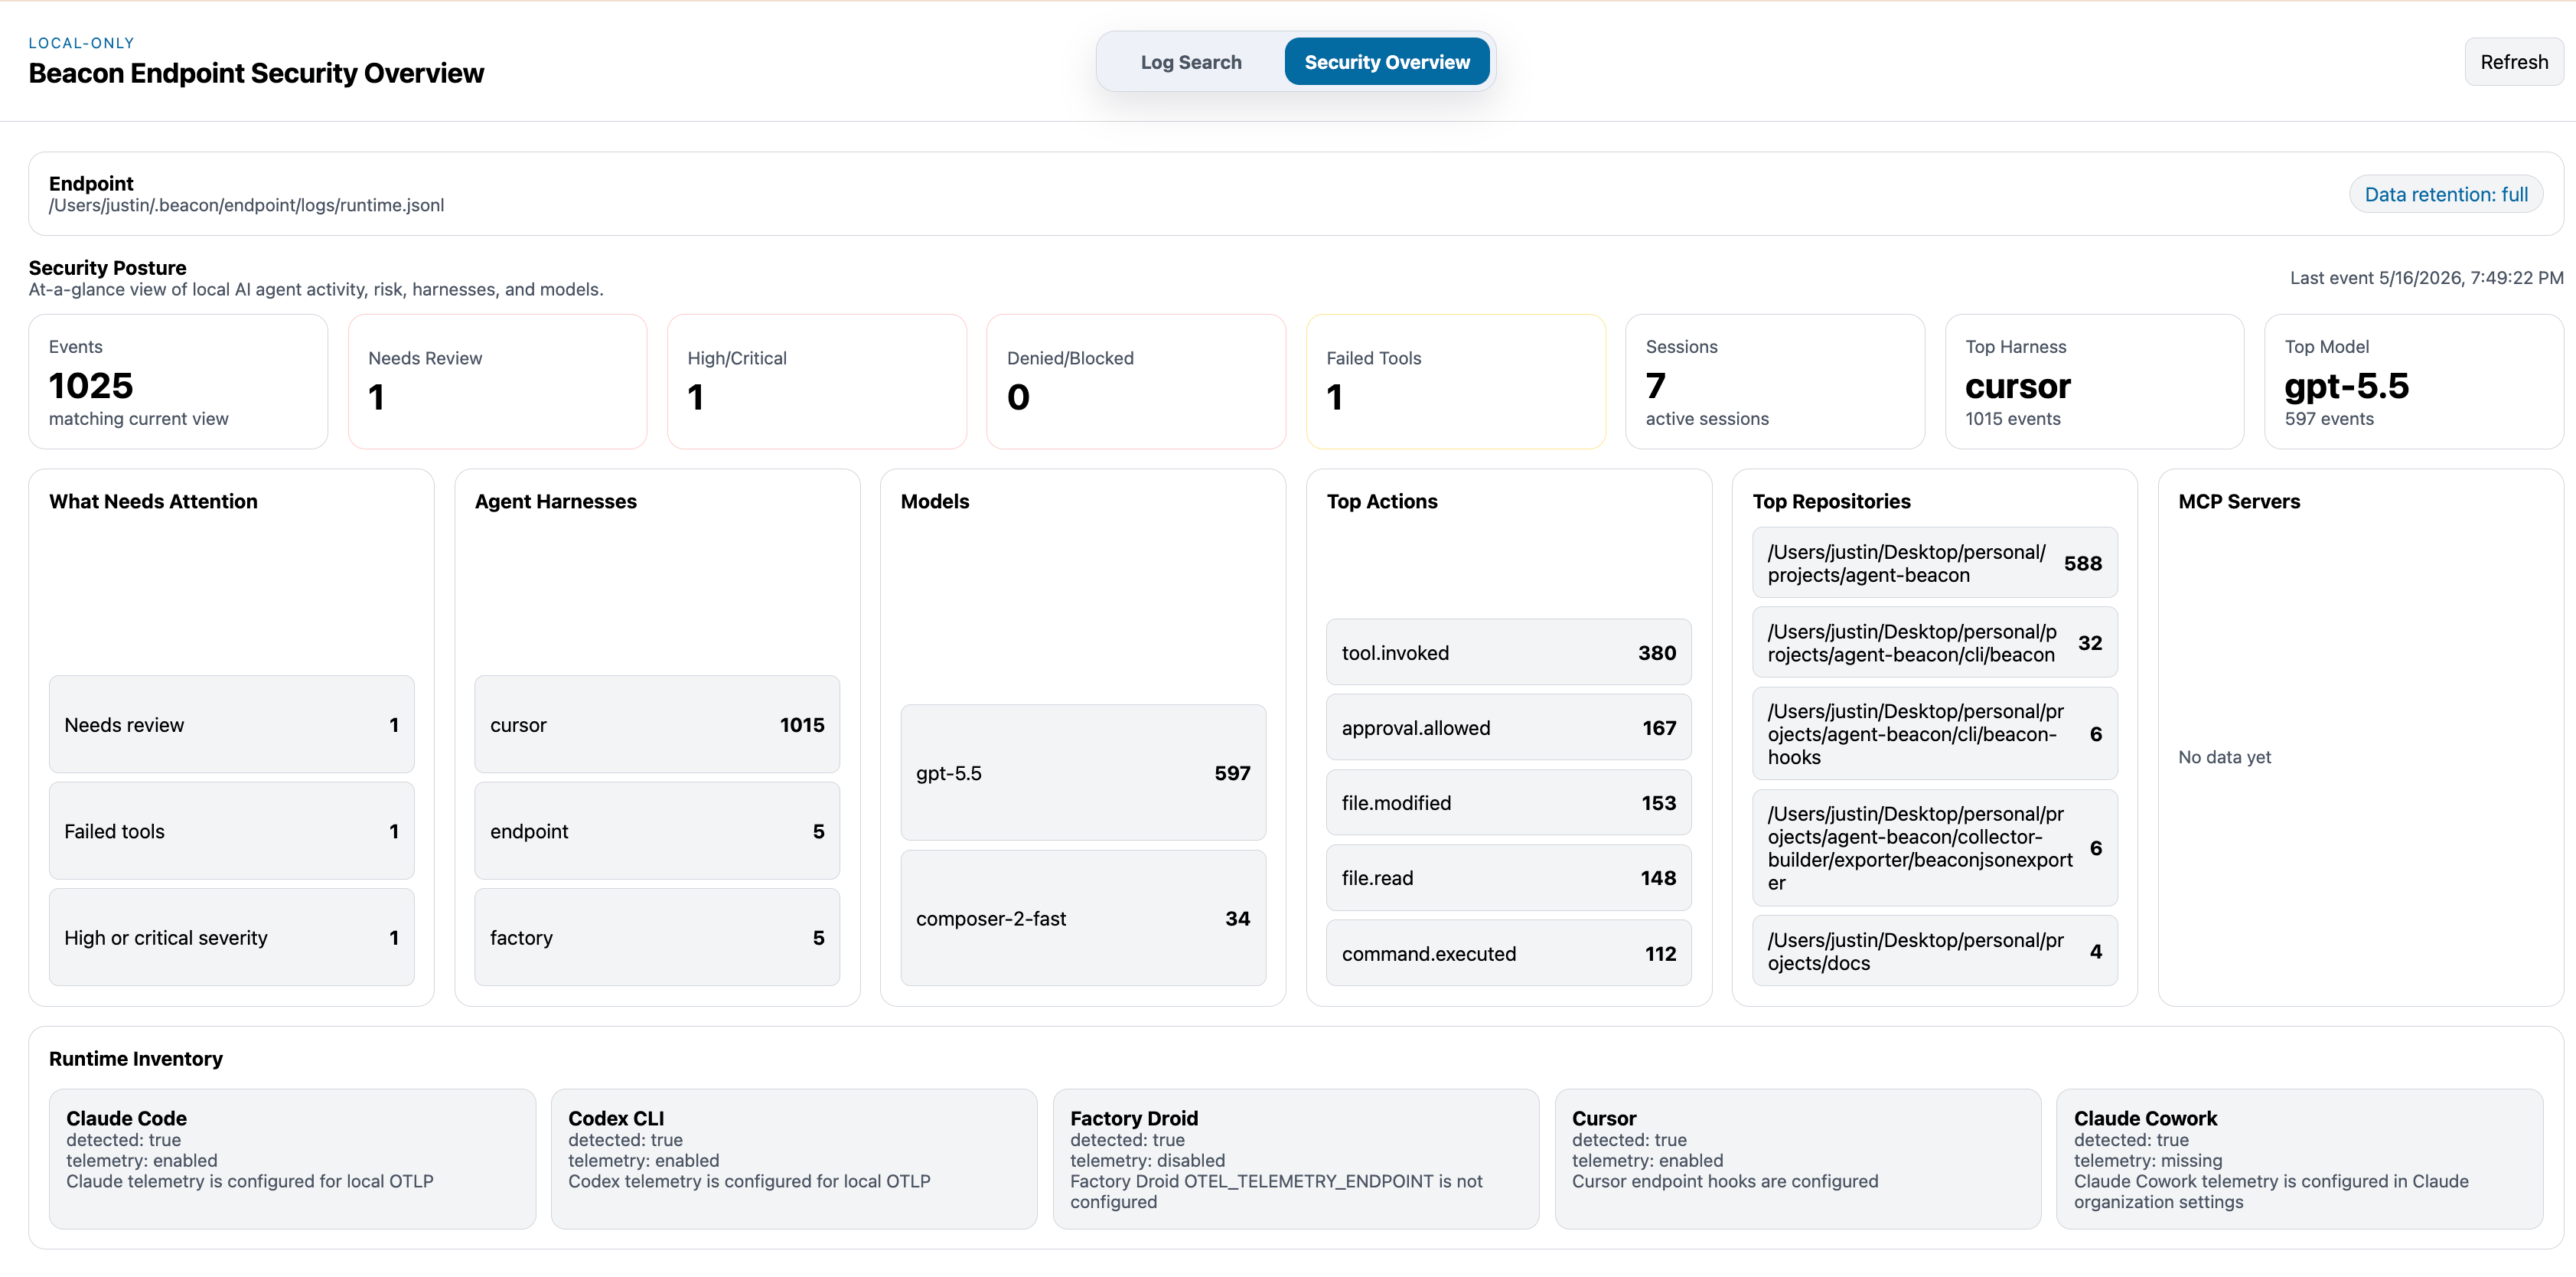 Security Overview is useful for confirming event totals, needs-review counts, high or critical activity, denied or blocked activity, failed tools, sessions, top harnesses, top models, top repositories, MCP servers, and runtime inventory.
## Key Features Demonstrated
* Dashboard startup against the expected runtime log.
* Log Search visibility for a controlled validation event.
* Security Overview summaries for local runtime activity.
* Loopback-only inspection without a hosted Beacon account.
## Troubleshooting
If the dashboard opens but does not show expected events, check:
* The runtime log path shown by `beacon endpoint status`.
* Whether the validation event was written with `beacon endpoint test-event`.
* Whether you are testing user mode or system mode.
* Whether `--log-path` points at the same file you validated.
* Whether the expected event is in the active log or one of the numbered archives next to it.
## Related
Review all dashboard flags and command examples.
Write a synthetic event before testing dashboard visibility.
Confirm endpoint readiness before opening the dashboard.
Confirm the dashboard is reading the intended runtime JSONL log.
Security Overview is useful for confirming event totals, needs-review counts, high or critical activity, denied or blocked activity, failed tools, sessions, top harnesses, top models, top repositories, MCP servers, and runtime inventory.
## Key Features Demonstrated
* Dashboard startup against the expected runtime log.
* Log Search visibility for a controlled validation event.
* Security Overview summaries for local runtime activity.
* Loopback-only inspection without a hosted Beacon account.
## Troubleshooting
If the dashboard opens but does not show expected events, check:
* The runtime log path shown by `beacon endpoint status`.
* Whether the validation event was written with `beacon endpoint test-event`.
* Whether you are testing user mode or system mode.
* Whether `--log-path` points at the same file you validated.
* Whether the expected event is in the active log or one of the numbered archives next to it.
## Related
Review all dashboard flags and command examples.
Write a synthetic event before testing dashboard visibility.
Confirm endpoint readiness before opening the dashboard.
Confirm the dashboard is reading the intended runtime JSONL log.